The feel-lousy economy
If the U.S. economy is in a "recovery" phase, why are working people still hurting so badly? examines the thorny underside to the media's rosy picture.
BEFORE THE late-summer gyrations in the stock market brought worries of a new economic slowdown back into the headlines, the story of the U.S. economy's climb back from the depths of the 2007-09 recession was supposed to be a tale of "steady progress." As President Obama's introduction to the 2015 Economic Report to the President put it:
In 2014, our economy added jobs at the fastest pace since the 1990s. The unemployment rate plunged to its lowest point in over six years, far faster than economists predicted. Ten million Americans gained the security of health coverage. And we continued to cut our dependence on foreign oil and invest in renewable energy, making us number one in the world in oil, gas and wind power.
These achievements took place against a backdrop of longer‑term economic strength. Since the crisis, we've seen our deficits cut by two‑thirds, our stock market double and health care inflation at its lowest rate in 50 years. The housing market is rebounding. Manufacturers are adding jobs. More Americans are finishing college than ever before.

In June, the Bureau of Labor Statistics reported that the number of job openings hit its highest point since 2000. The average weekly number of Americans applying for unemployment remained consistently below 300,000, compared to more than 600,000 a week in 2009. As a percentage of the size of the U.S. labor force, the number of workers applying for unemployment benefits is actually at a near-50 year low.
But at the same time that these statistics tell a "good news" story about the job market and economic recovery, it's clear that most workers aren't feeling it.
Just before last year's midterm elections in November, the Pew Center for People and the Press found that only 21 percent of people considered the economy to be in "good or excellent" shape, compared to the 33 percent who considered it in poor shape. And higher percentages of Americans predicted the economy would be in worse shape in the following year than they did in 2010 or 2012.
If all the "good news" is true, why do most workers feel as if they're only getting bad news, with worse to come? To find out why, we have to dig deeper than the headlines and the often superficial way that the financial press equates the health of the stock market with the health of the economy.
The Mystery of the Shrinking Paycheck
The most obvious place to start is with the size of workers' paychecks.
Unemployment may have dropped by half since the worst point of the Great Recession, and workers have more flexibility to quit jobs to get better ones. But those short-term trends haven't changed a nearly four-decade-long decline in U.S. workers' standard of living.
The median annual income of a male U.S. worker, working full time, was less in 2014 (at $50,383) than in 1973 (at $53,291), in inflation-adjusted dollars.
A woman working full-time earned about $9,000 more in 2014 than in 1973 (moving from $30,180 to $39,621 in annual income). This certainly illustrates the crucial role that working women play in supporting households. But in the last half of that period--since the tight labor market of the late 1990s--neither men nor women have seen any sustained increase.
As a result, most American households have experienced economic stagnation or worse for the last decade and a half. For non-elderly households, real median household income, adjusted for inflation, dropped 12.3 percent, from $66,845 to $60,462, between 2000 and 2014.
This driving down of living standards reflected the impact of two recessions in that period--2001-03 and 2007-09--the latter being the worst slump since the Great Depression of the 1930s. But it also reflected more long-term trends.
Recessions have been a recurring factor throughout the history of capitalism. But in all of the ones that took place in the 20th century after 1945, the job market and economic growth experienced sharp "snapbacks"--in most of these recessions, employment returned to its previous high within two years.
The 21st century recessions have been different. The 2001-03 recession required almost four years to restore employment, and after the Great Recession, the U.S. economy only reached 2007 job levels in June 2014.
Clearly, something is different about these more recent recessions and recoveries.
Workforce demographics may provide part of the explanation. As the "baby boom" generation ages toward retirement--either voluntary or due to disability--and younger people remain in school longer, the active laboring population has shrunk. In the late 1990s, almost 85 percent of 25- to 54-year-olds in the U.S. were working or looking for work. That number began to decline in 2000 dropped to just above 80 percent by 2015.
This long-term shift ran headlong into the two 21st-century recessions, which pushed more people out of the labor force--some permanently, others temporarily.
Because the size of the "prime working age" population is a good predictor of economic growth, the long-term downward trend in labor force participation helps explain why the 21st century economy has been sluggish and recoveries tepid. In fact, the relation of these demographic factors to economic growth is a key part of former Treasury Secretary Larry Summers' case that the U.S. economy is experiencing "secular stagnation."
Another crucial factor is the fact that government austerity and attacks on workers' living standards have sustained corporate profits, even in a slow-growth environment, as Canadian Marxist David McNally explained: "We have a capitalism that is profitable, with high unemployment. It's a unique combination of capitalist austerity that is working in terms of profits, but it is not restoring economic growth to any degree that would really resolve the jobless crisis."
While Summers and like-minded commentators have urged the U.S. and other major countries to stop the destructive austerity policies that have compounded the sluggish recovery, the austerians don't seem in the mood to listen. And if McNally's Marxist analysis is right, why would they?
That's one main reason why Barack Obama's eight years in office are likely to end with a net loss of jobs in the public sector--with most of the decline coming at the state and local levels.
What Kind of Jobs?
On the other hand, as Obama is never shy about touting, the economy during his second term is on pace to create more private-sector jobs than any recent administration, save Bill Clinton's. If jobs are finally coming back, it makes sense to ask "what kind of jobs?"
Each May, the Bureau of Labor Statistics publishes a report on "occupational employment statistics" that gives a snapshot of the types of jobs that make up the population of people employed by firms, government and non-profits in the U.S. economy. The statistics appear one year later than the data are collected, so the most current available information is from May 2014.
But even the bland language of a government press release captures something about the nature of the jobs that most Americans do:
Most of the largest occupations were relatively low paying. Excluding registered nurses, annual mean wages for the rest of the 10 largest occupations ranged from $19,110 for combined food preparation and serving workers to $34,500 for secretaries and administrative assistants, except legal, medical and executive.
Comparing the latest data from May 2014 and the numbers from May 2009--the month before the Great Recession officially ended--the greatest absolute number of jobs created during those five years--about 1 million in all--fell into the "food preparation and service-related occupations" group, where the median annual salary in 2014 was just over $19,000. (See the "Winners and Losers" table below.)
Employment in the food service sector increased 9.4 percent since 2009. But that was only half the size of the percentage increase in the "personal care and services" sector--occupations like childcare workers, cosmetologists and animal care workers--grew by more than 20 percent from 2009 to 2014, for an increase of 692,000 jobs in a sector with a median annual salary of $21,260.
Other major sectors that added more than half a million jobs included "sales and related occupations" (expanding by 3.9 percent, with a median annual salary of $25,360)--but also "computer and mathematical science occupations" (up 16.1 percent, median salary of $79,420), "business and financial operations occupations" (12.6 percent, $64,790) and "management occupations" (10.2 percent, $97,230).
Here, we see illustrated what liberal Harvard University economist Lawrence Katz and his colleagues have identified as the "polarization" of the U.S. labor market. The "free market" economy is creating two types of jobs: a mass of low-wage jobs, on the one hand, and a smaller but still substantial number of high-wage jobs in the technical and managerial sectors, on the other.
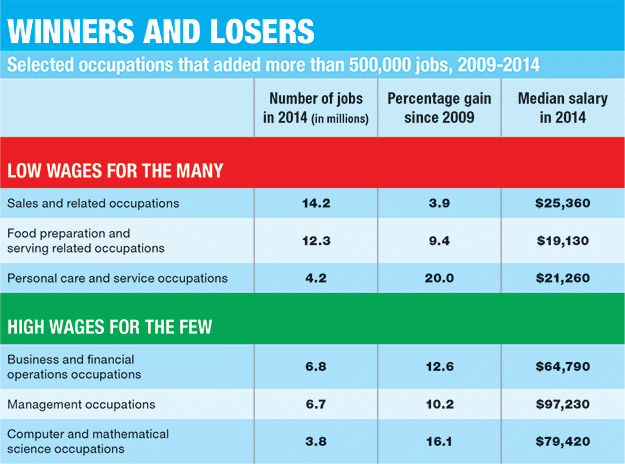
So while the majority of U.S. workers continue to feel constant pressure of barely scraping by, a smaller group of well-paid professionals and managers is doing quite well.
Even given this polarization of incomes, it's notable that the median employee in none of the broad 22 occupational groups that the Labor Department tracks had, as of 2014, seen gains in real income since 2009. If wages from 2009 had just kept pace with inflation, they would have been about 11 percent higher in 2014. None were.
But that isn't to say that no one made gains during the recovery. When you drill down into the statistics, you find that for various types of managers (for sales, purchasing, computer and information science, and health and medical services, among others), the median individual made more than $100,000 a year--and their income gains outpaced inflation.
The only other main industrial concentration where we see real income gains is the oil and gas industry--for wellhead pumpers, mine cutting and channeling workers, gas compressor and gas pumping station operators. They owed their good fortune to the fracking boom whose bubble popped this year. It's a good bet that the 2015 update to these data will show oil and gas occupations losing ground.
By compounding and accelerating longer-term trends, the Great Recession produced an economy polarized between the poorly paid many and a well-remunerated few, with a shrinking middle.
Productivity and Profit
One of the orthodox assumptions of both liberal and conservative economics is that a more productive economy leads to higher living standards.
According to the theory, when workers are better educated and better trained, and when technology is intelligently deployed to increase economic efficiency, the overall economy produces more and workers earn more.
Or so the theory goes. What's the evidence?
The alleged association between the economy's productivity and workers' wages proved true between 1948 and 1973--productivity increased by about 97 percent and workers' incomes increased by 91 percent, after accounting for inflation.
But since then, it's a different story. On the one hand, the number of Americans over 25 with a bachelor's degree or higher grew from 19 percent in 1973 to 34 percent in 2014. During the same time period, output per hour worked--the standard measure of economic productivity--increased by about 72 percent. So workers are more educated and more productive--but their incomes have either stagnated or declined since 1973.
The period between 1948 and 1973 was the longest boom period in capitalism's history, representing the heyday of the "American dream." It was also an era when unions represented between one-quarter and one-third of U.S. workers. Being a union member when labor was strong helped workers to claim a share of the economic expansion they produced--and union wages and benefits set the pace for many nonunion workers as well.
In the neoliberal era that followed the mid-1970s, productively increased at a slightly lower rate than in the earlier period. But still, it did rise--and hardly any of the productivity gains found their way into workers' pocketbooks. Not coincidentally, employers have largely succeeded in eliminating the power of unions in all but a few sectors of the economy--and those are under siege.
To analyze the long-term shift in the economy and what it means for workers today, researchers at the Economic Policy Institute compared the measure of productivity from 1973 to 2014 with various calculations of wages and salaries: average hourly compensation, which averages everyone's paycheck, from CEOs to fast-food workers; and median hourly compensation, the pay for the person at the exact middle of the American income ladder. (See the "Making More and Earning Less" graph below.)
These comparisons produced illuminating findings. Between 1973 and 2014, the median worker's hourly compensation increased by 8.7 percent, while average compensation increased by 42.5 percent in the same period.
Why the gap between two statistics about income over the same period of time? Because when all incomes are averaged together, the super-high salaries of those at the top skew the number higher. The difference between median and average shows that changes in income for the majority of workers have been barely perceivable over 40 years, while a much smaller group of CEOs, managers and the upper middle class in general did so much better that they pulled the average much higher.
In other words, this comparison backs up the common--and correct--perception that the rich are getting richer, while the rest of us are just getting by. That, by itself, is the largest single explanation for the divergence between productivity and workers' living standards in the neoliberal era, according to the EPI researchers.
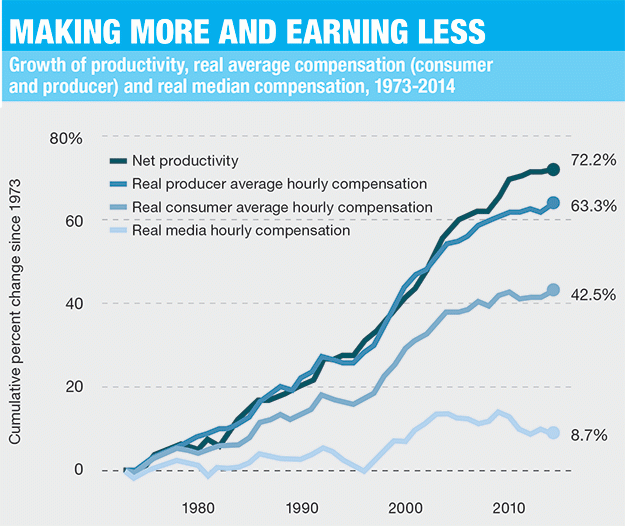
The EPI researchers dug a little deeper and calculated the increase in average hourly compensation two different ways. In one calculation, they adjusted the income rise to account for inflation over 40 years, based on the conventional measure of a standard "market basket" of goods, like groceries and gasoline, and services, like rent and college tuition--things that workers have to buy. In the other, they adjusted for inflation based on "producer prices"--including things like machinery or computer and office equipment or raw materials, which companies and corporations buy in order to do business.
Once again, there was a significant gap in two measures of the same thing. The increase in average compensation, adjusting for inflation using consumer prices, was 42.5 percent, while the average increase, adjusting for inflation using producer prices, was 63.3 percent.
Essentially, this shows that prices for the kinds of basic products and services ordinary people have to buy have risen faster than those corporations spend money on--and so working people's paychecks have taken a bigger hit than corporations' accounts payable.
The long and short of it is: Workers are not only feeling the pinch in their flat-lining paychecks--they also feel it in grocery bills, housing and education expenses.
Productivity--that is, the overall measure of economic output per person hours worked--increased faster than any of the measures of compensation: 72.2 percent over the same period. The difference between what workers produced overall and what they were paid--with the median figure of 8.7 percent being the most accurate statistic for what a typical worker receives--represents huge profits flowing into capitalist bank accounts.
This isn't simply an abstraction or a math trick. Between 2000 and the second three-month period in 2015, the percentage of corporate income going to workers' wages dropped from 82.3 percent to 75.5 percent, according to the Commerce Department's Bureau of Economic Analysis.
If that proportion of wages to corporate income hadn't changed over those 15 years, workers today would collectively have $535 billion more in their paychecks--roughly speaking, $3,770 more per worker.
"A Counter-Power from Below"
In this "feel-lousy" economy, where millions of workers live under the constant pressure of not being able to make ends meet, the ground is fertile for right-wing demagogues like Donald Trump who want to turn workers' economic anxieties against immigrants and the poor.
But the broad support for Vermont Sen. Bernie Sanders' calls for a "political revolution" against the "billionaire class" shows that millions more want to focus on the real culprits: the architects of this economy.
However, no politician--not even Sanders, even if he had a fair chance to win the presidency--can bring about the change that's really needed to shift the trends described here in a positive direction.
That will only come through collective organization and action, as David McNally argued:
If you want to stop [austerity and declining living standards], you can't simply try to do this educational work, saying it's bad for the economy. You actually have to raise the question that radical working class and social movements of the 1930s did, which is how do we shift the balance of social forces in our society? How do we build a counter-power from below that is actually capable of winning victories against the agenda and begins to build an actual social force that is capable of articulating and shaping an alternative?